Het monitoren van servers is een cruciaal element om alles soepel draaiende te houden. Ik gebruik hiervoor Prometheus en grafana om een overzicht te hebben op het resourcegebruik. In deze post licht ik toe hoe ik Prometheus en Grafana heb geconfigureerd.
Node exporter installeren
Om de statistieken van onze target systemen te verzamelen gebruik ik node_exporter. Node exporter maakt bepaalde gegevens zoals cpu gebruik, ram gebruik en disk gebruik beschikbaar zodat prometheus deze kan uitlezen.
Om node_exporter te installeren op een Debian systeem kunnen we het volgende uitvoeren
sudo apt install prometheus-node-exporter
Eens dit geïnstalleerd is kunnen we verder gaan met het installeren van prometheus en grafana. Deze stappen hoef je dus maar op 1 server te doen.
Prometheus installeren
Prometheus is beschikbaar als Debian package en kan met het volgende commando geïnstalleerd worden.
sudo apt install prometheus
Vervolgens moeten we “/etc/prometheus/prometheus.yml” wijzigen en er de volgende inhoud in plaatsen:
global:
  scrape_interval: 15s
  scrape_timeout: 10s
  evaluation_interval: 15s
  external_labels:
    monitor: example
scrape_configs:
- job_name: prometheus
  honor_timestamps: true
  scrape_interval: 5s
  scrape_timeout: 5s
  metrics_path: /metrics
  scheme: http
  follow_redirects: true
  enable_http2: true
  static_configs:
  - targets:
    - monitoring-srv1.local:9100
    - monitoring-srv2.local:9100
Pas de targets aan naar de systemen die je wilt monitoren. Herstart nadien prometheus
sudo service prometheus restart
Als we naar de volgende URL surfen, kunnen we kijken of de configuratie goed is ingesteld:
http://<ip>:9090/classic/targets
Grafana installeren
Omdat grafana niet beschikbaar is in de Debian repositories, moeten we de repositories van grafana nog zelf toevoegen:
sudo apt-get install -y apt-transport-https software-properties-common wget
sudo mkdir -p /etc/apt/keyrings/
wget -q -O - https://apt.grafana.com/gpg.key | gpg --dearmor | sudo tee /etc/apt/keyrings/grafana.gpg > /dev/null
echo "deb [signed-by=/etc/apt/keyrings/grafana.gpg] https://apt.grafana.com stable main" | sudo tee -a /etc/apt/sources.list.d/grafana.list
sudo apt-get update
sudo apt install grafana -y
sudo systemctl enable grafana-server --now
Vervolgens kunnen we een browser openen en naar “<ip>:3000” surfen. We kunnen dan aanmelden met “admin” als gebruikersnaam en wachtwoord.
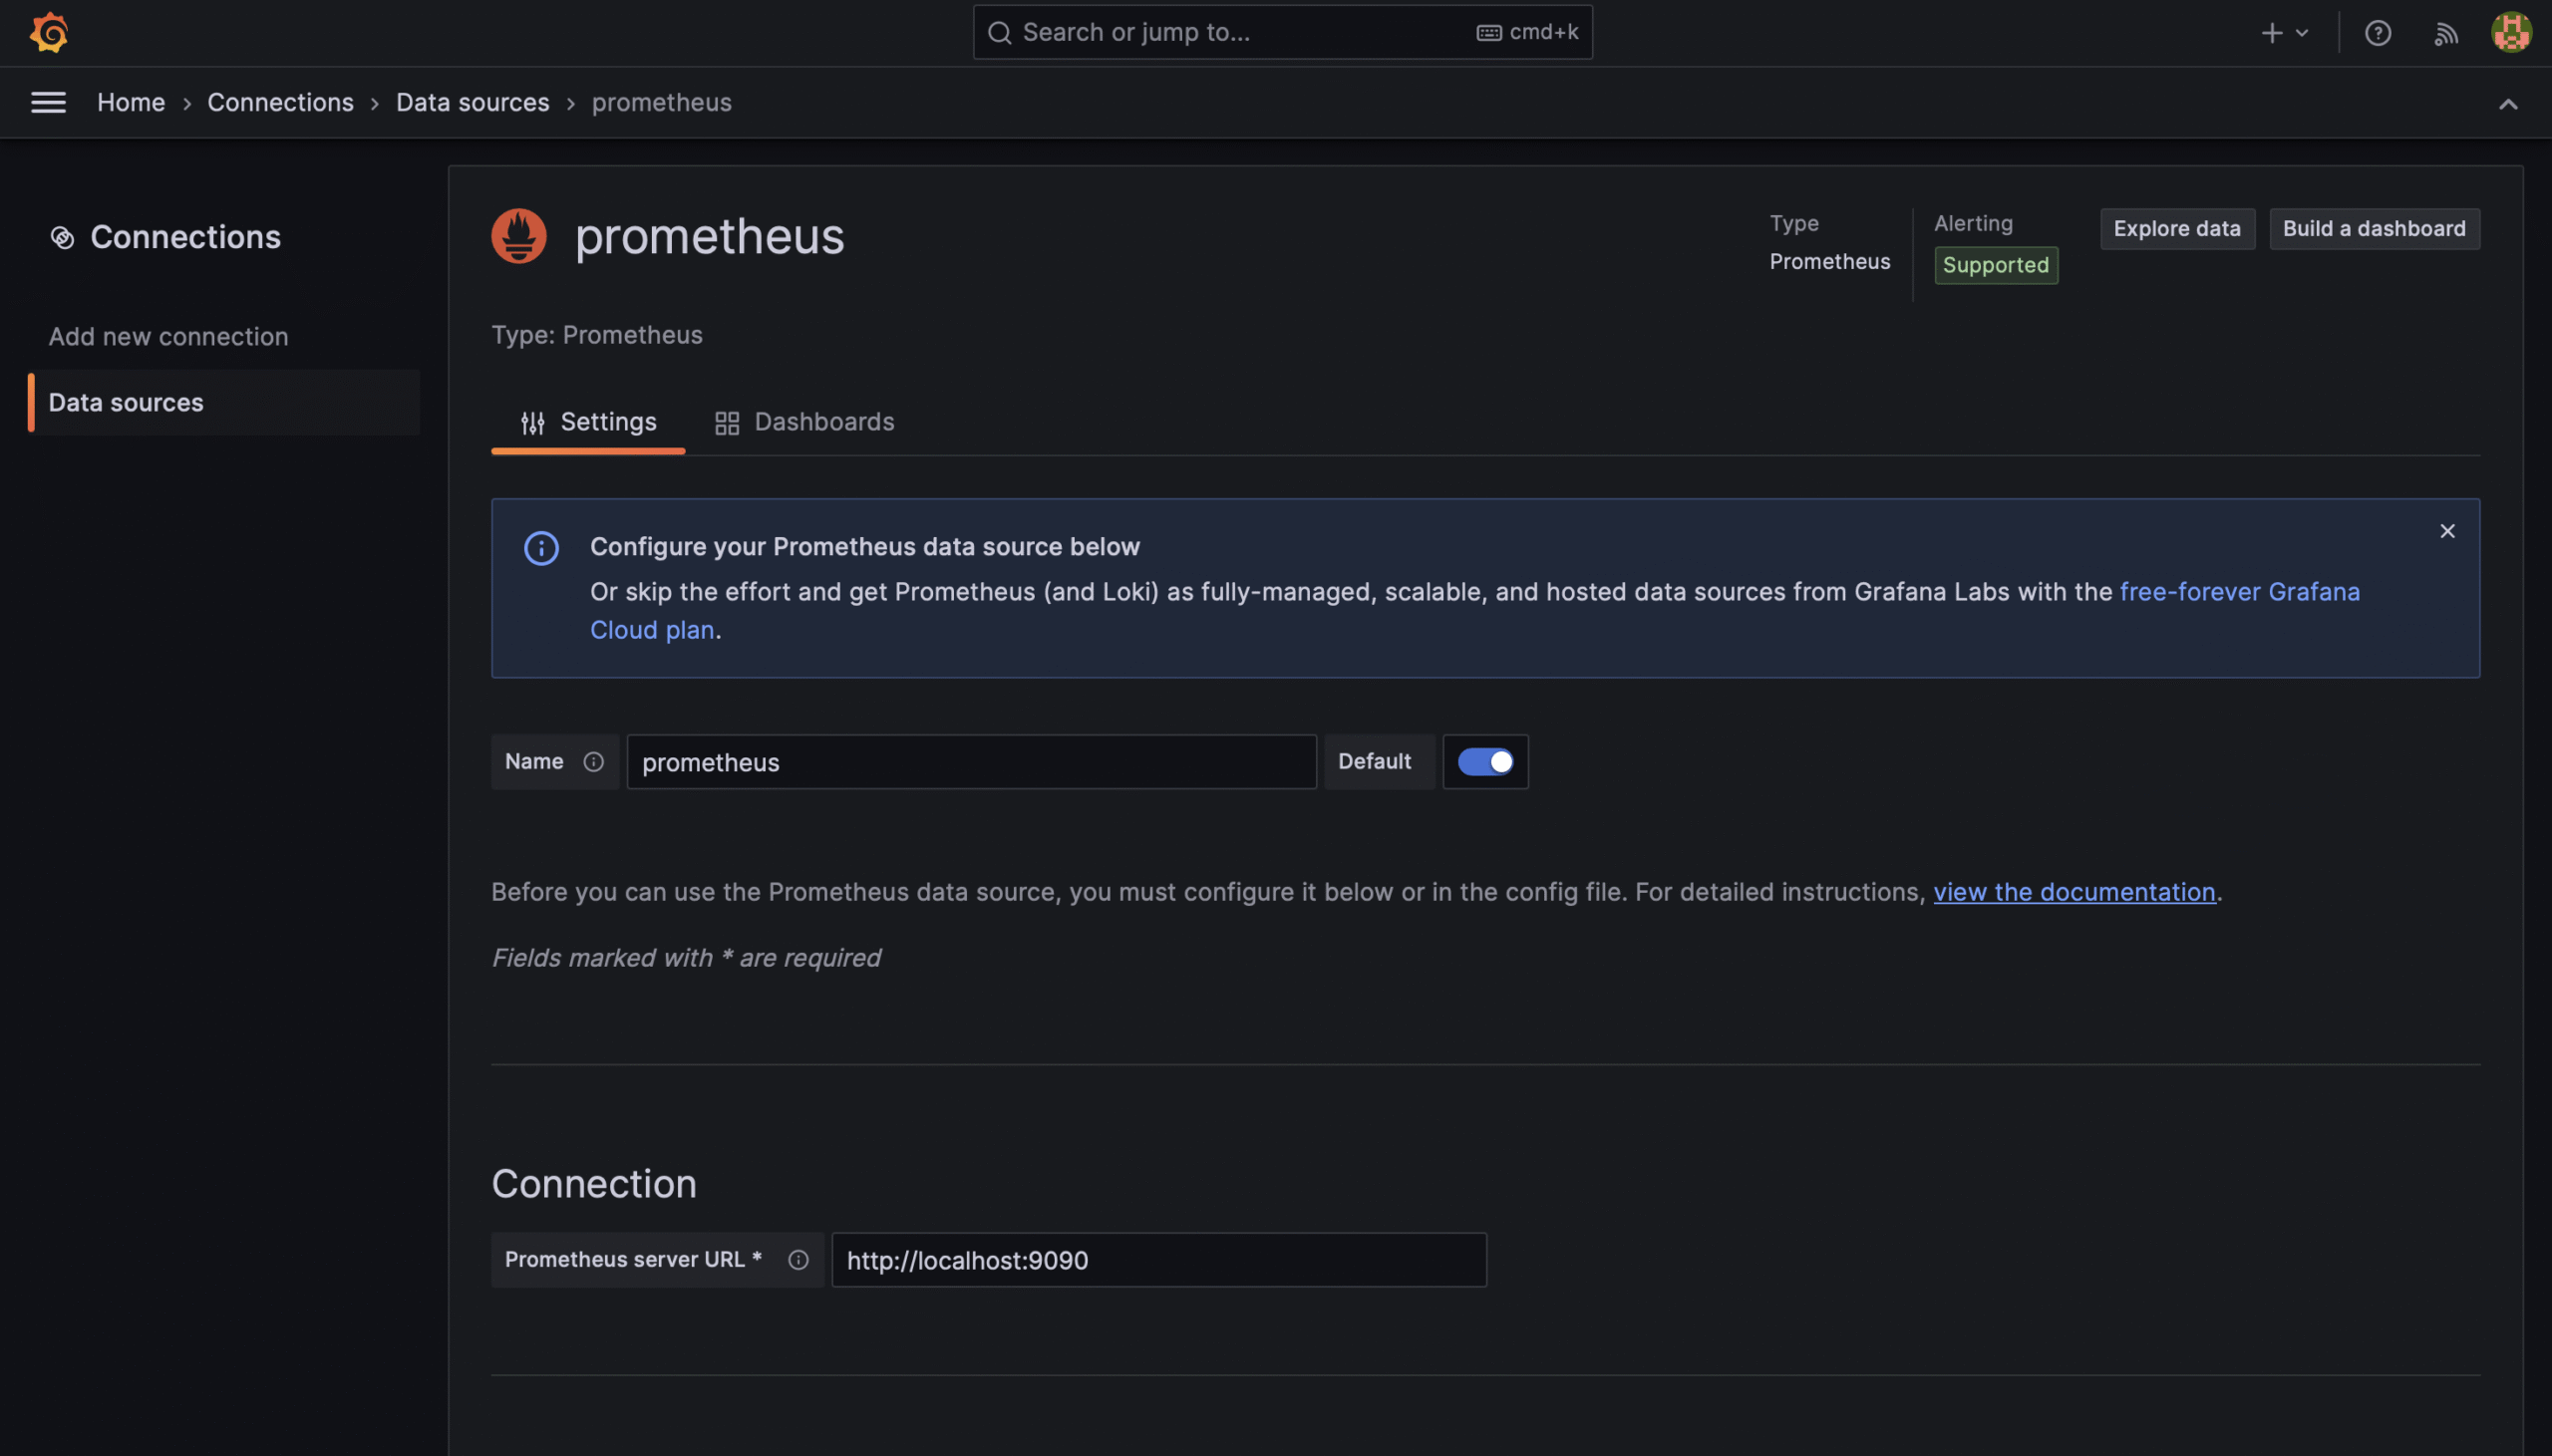
Eens ingelogd, kunnen we onze eerste databron toevoegen. Klik op “Add your first datasource”, selecteer prometheus en vul “http://localhost:9090” in als de URL naar prometheus.
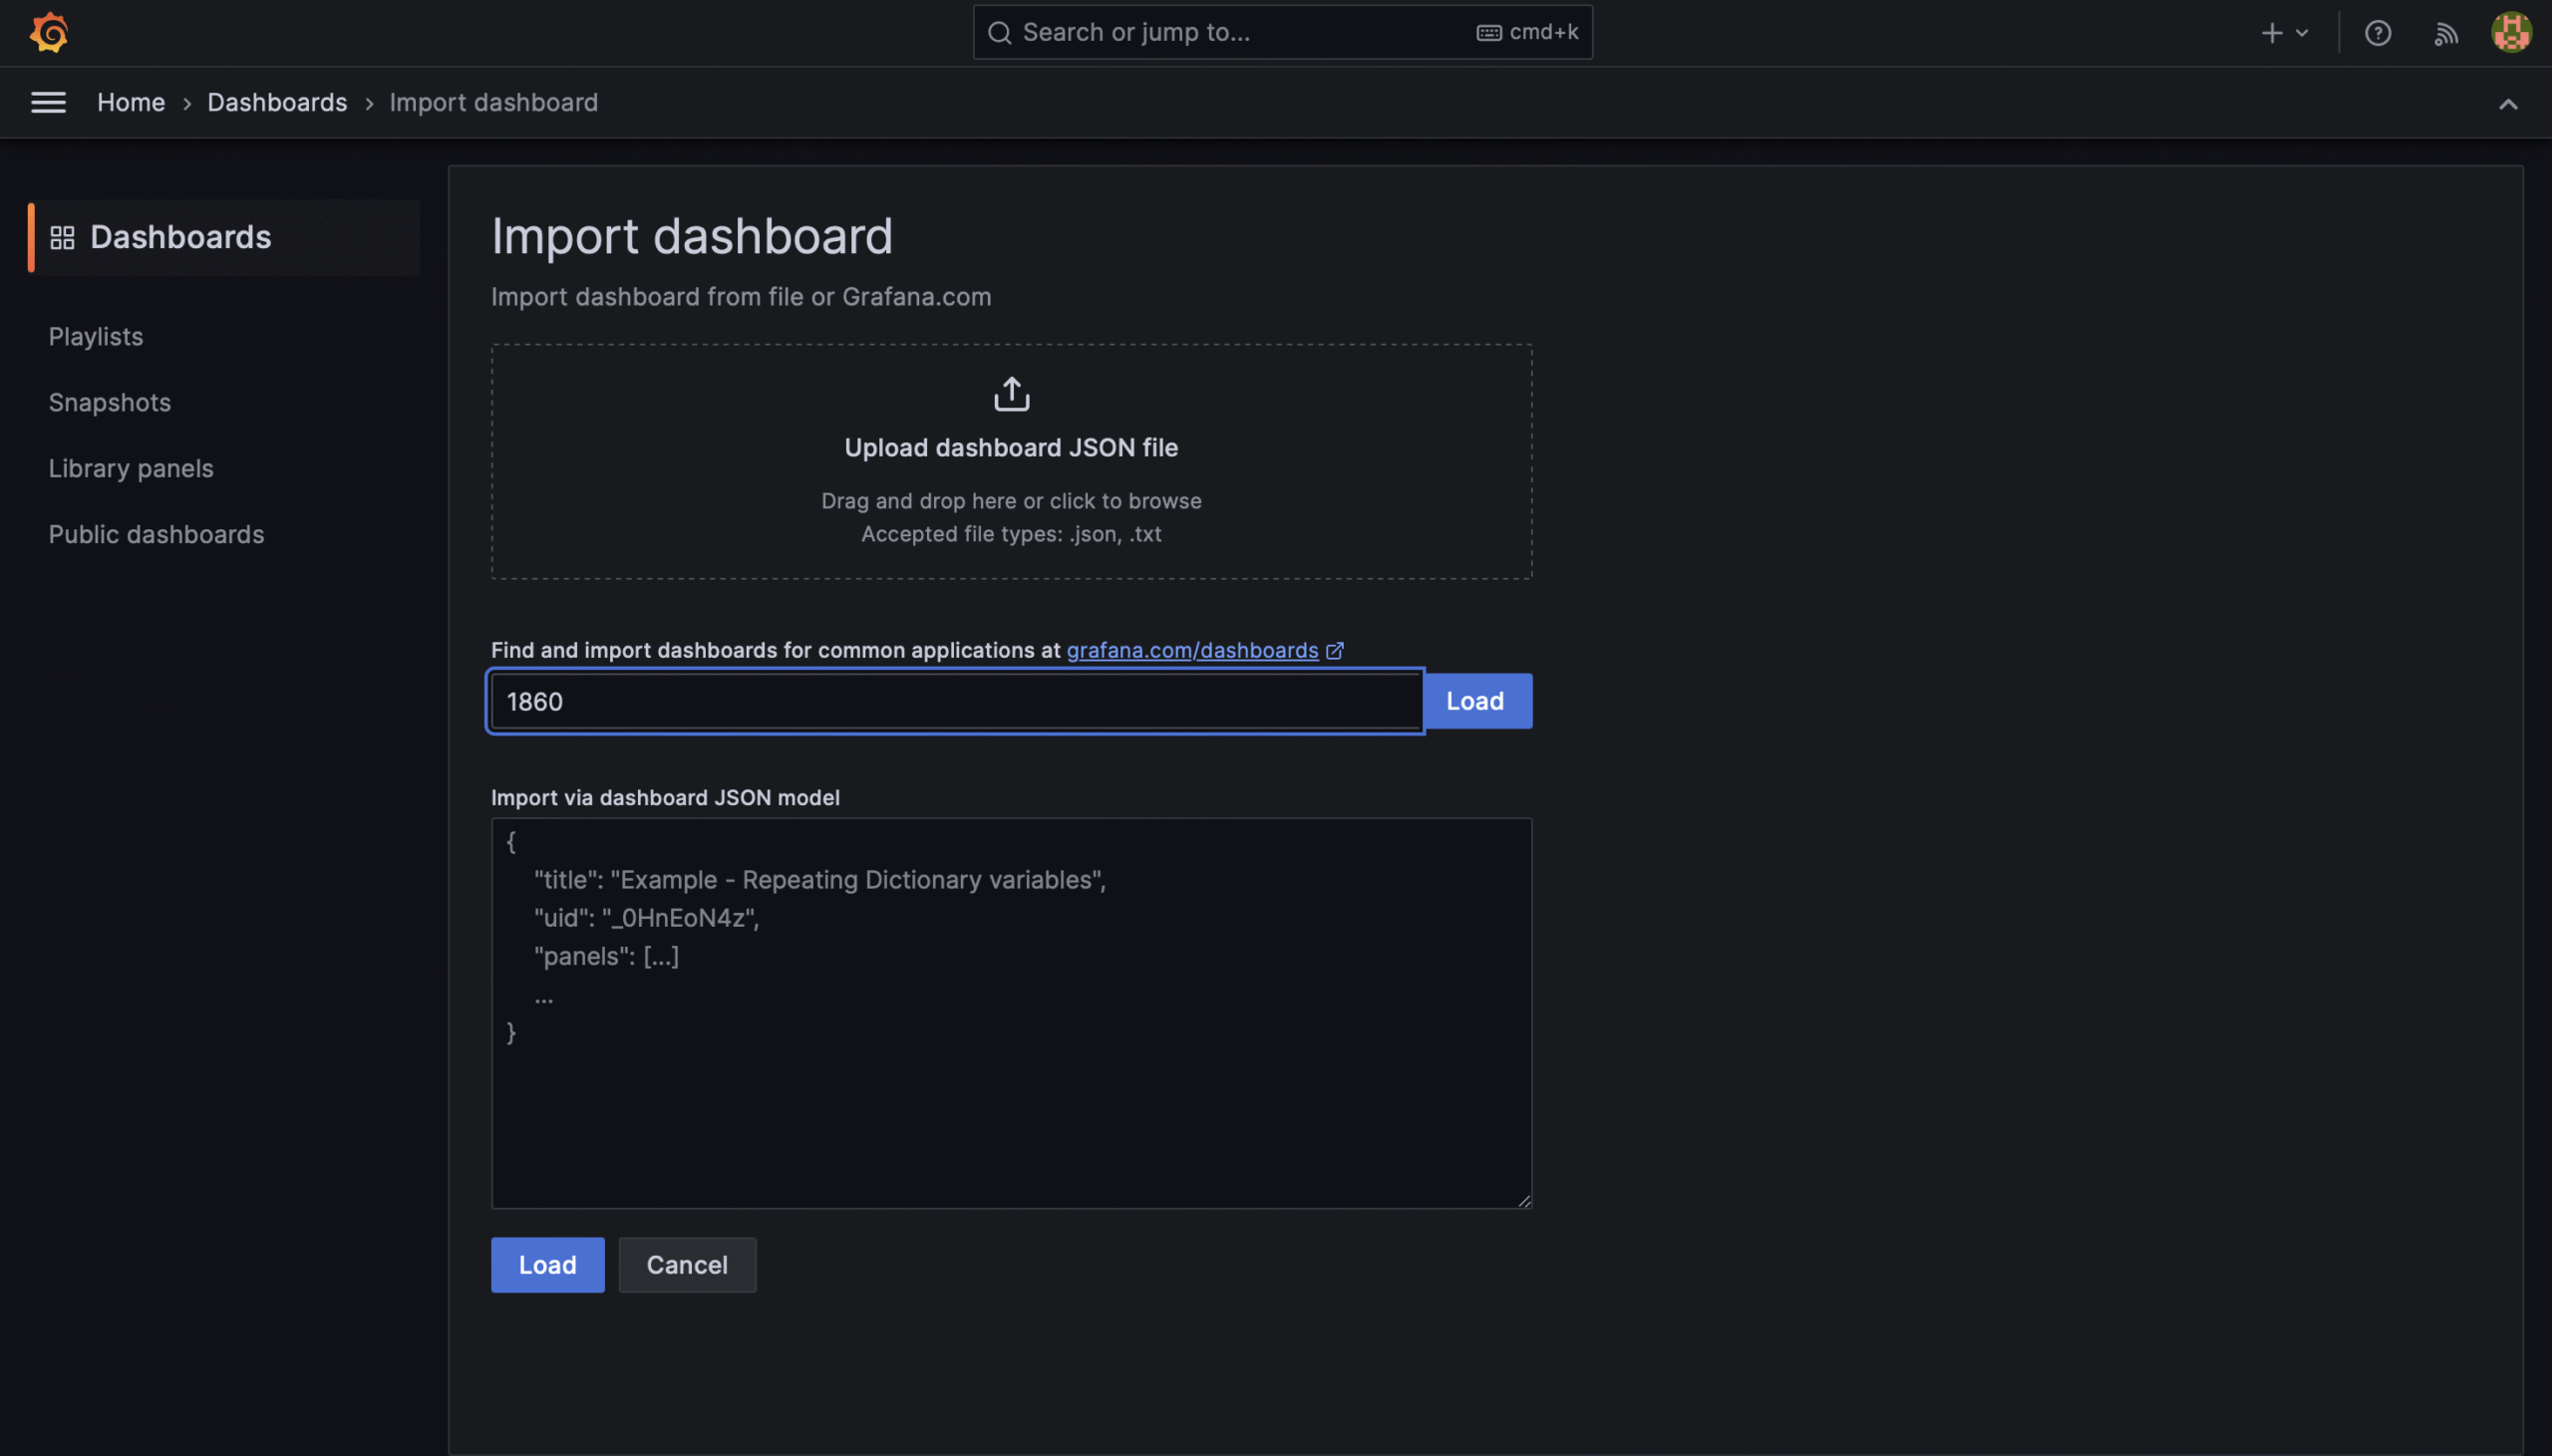
Vervolgens kunnen we terug naar het startscherm gaan en klikken op “Add your first dashboard”. Klik op “Import dashboard” en voeg “1860” in als het ID, en klik op “load”.
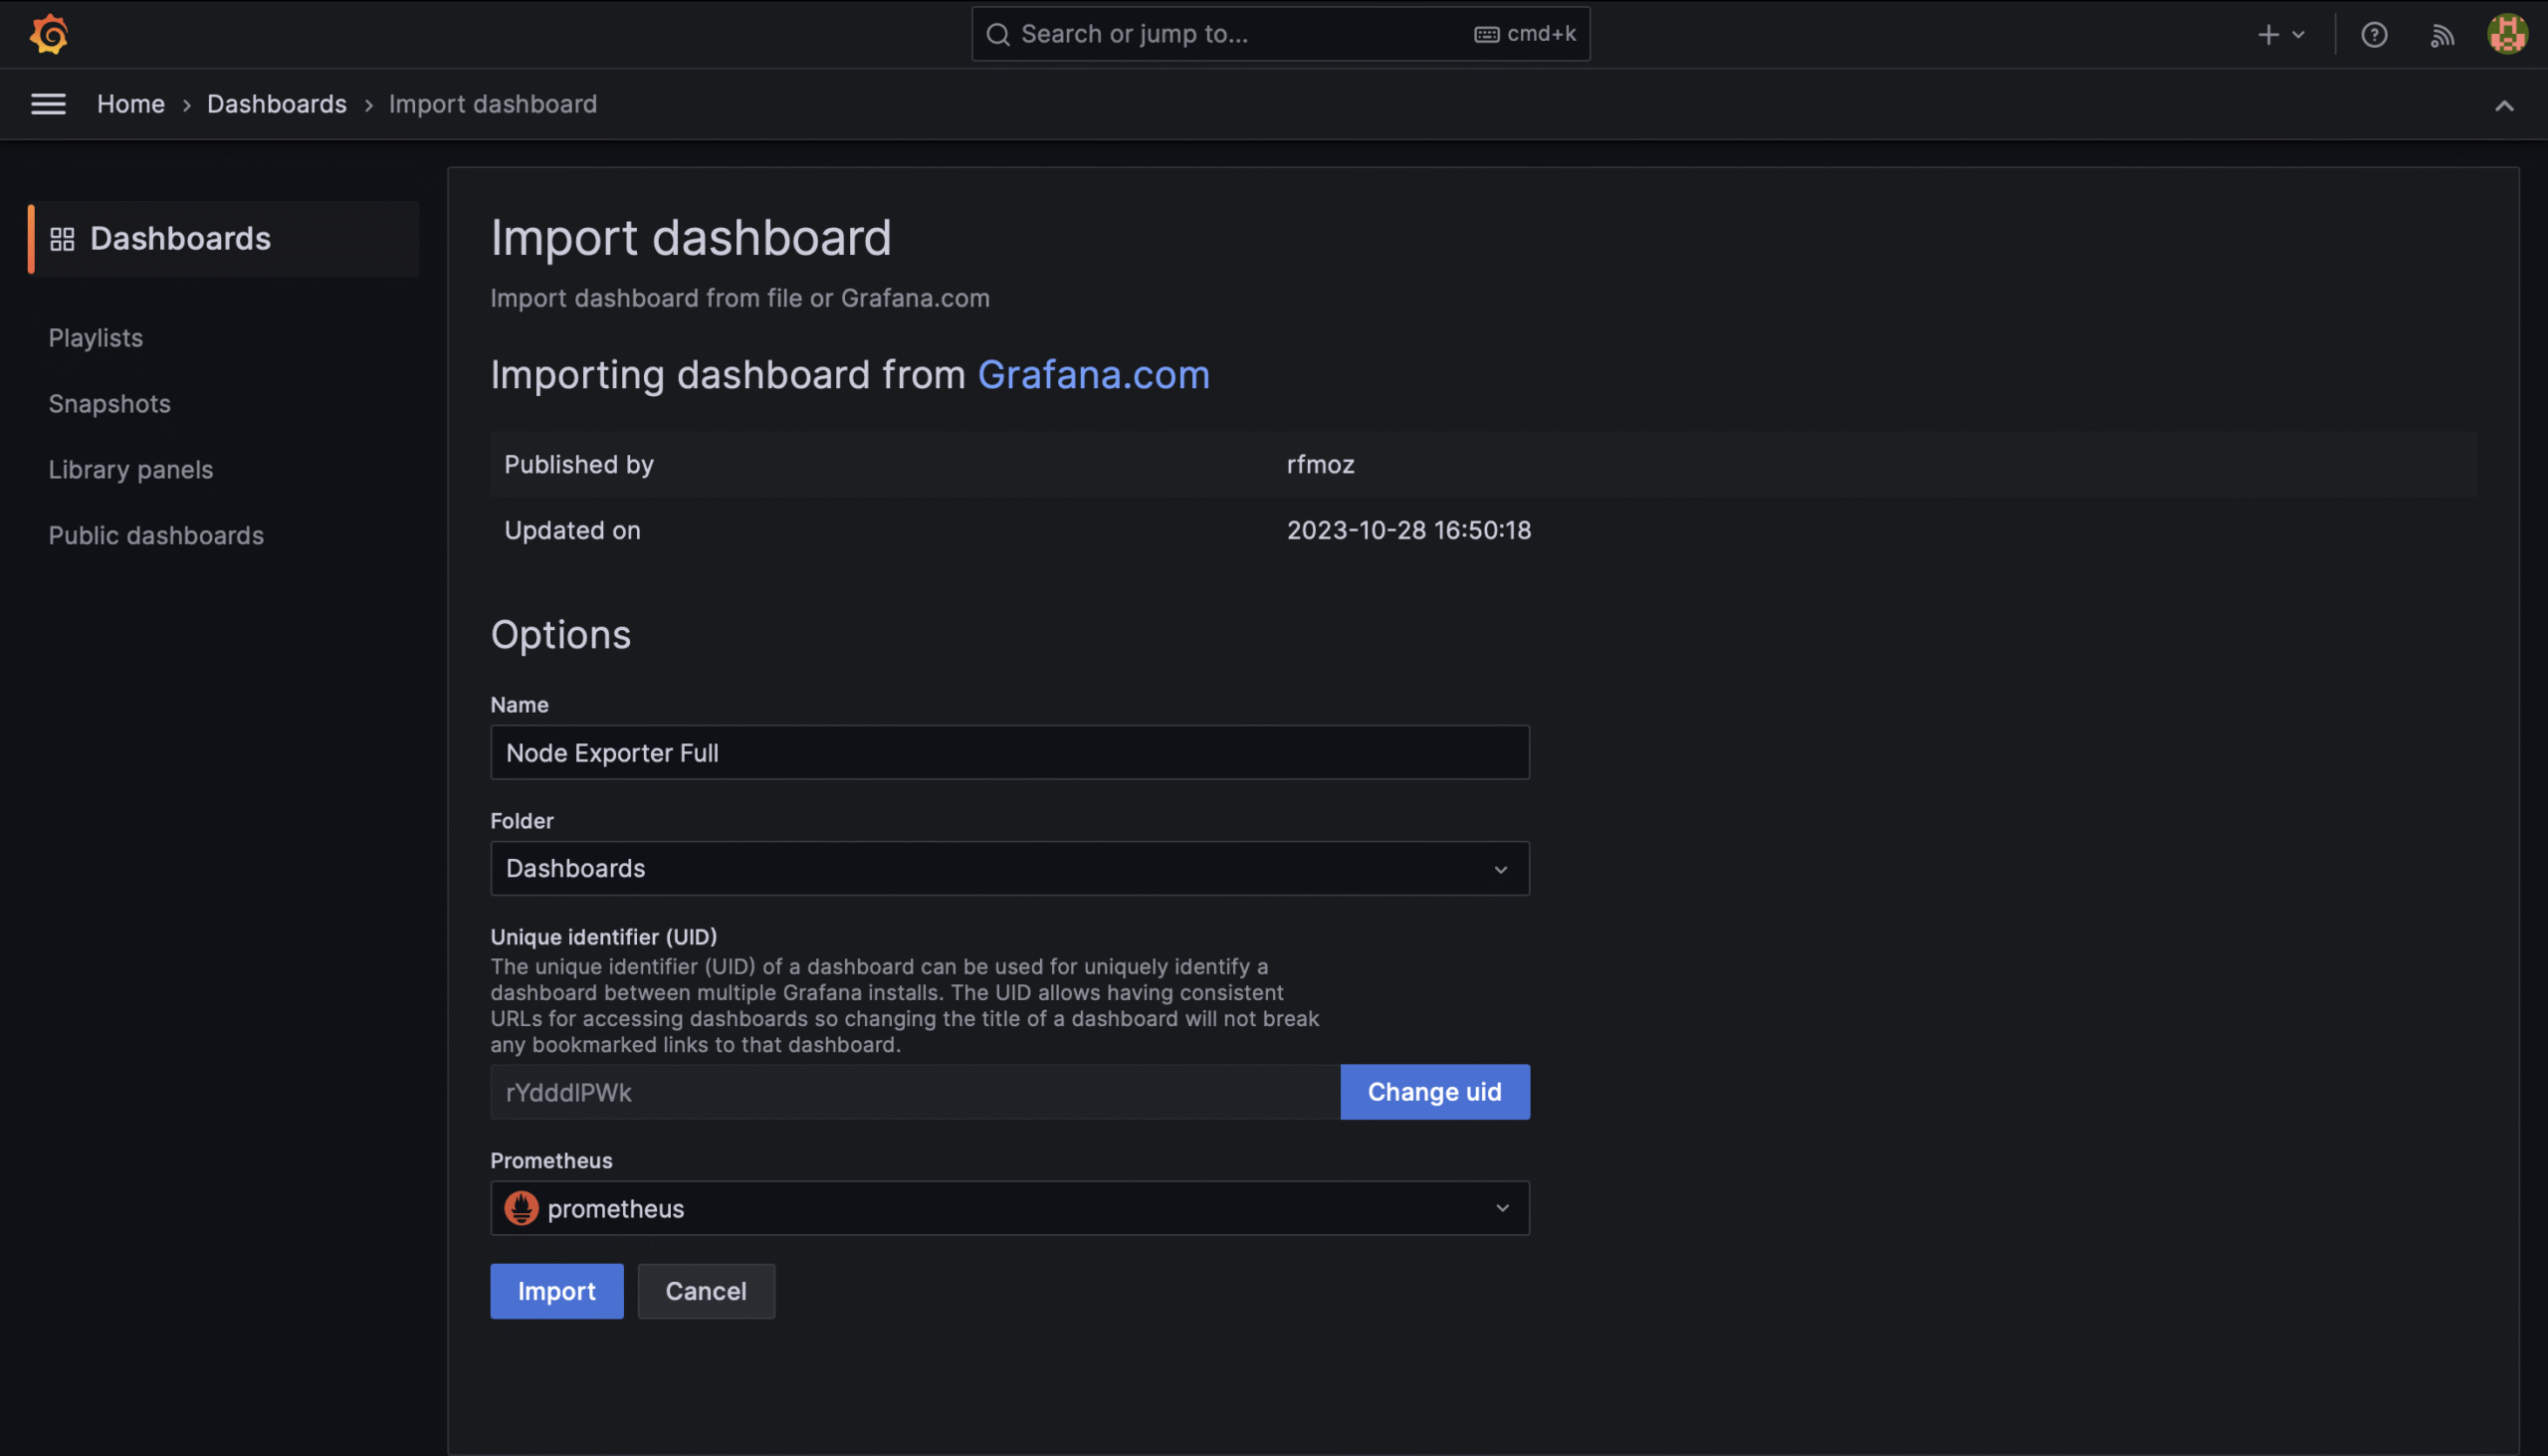
Vervolgens kunnen we de datasource kiezen die we eerder hebben toegevoegd en op “import” klikken.
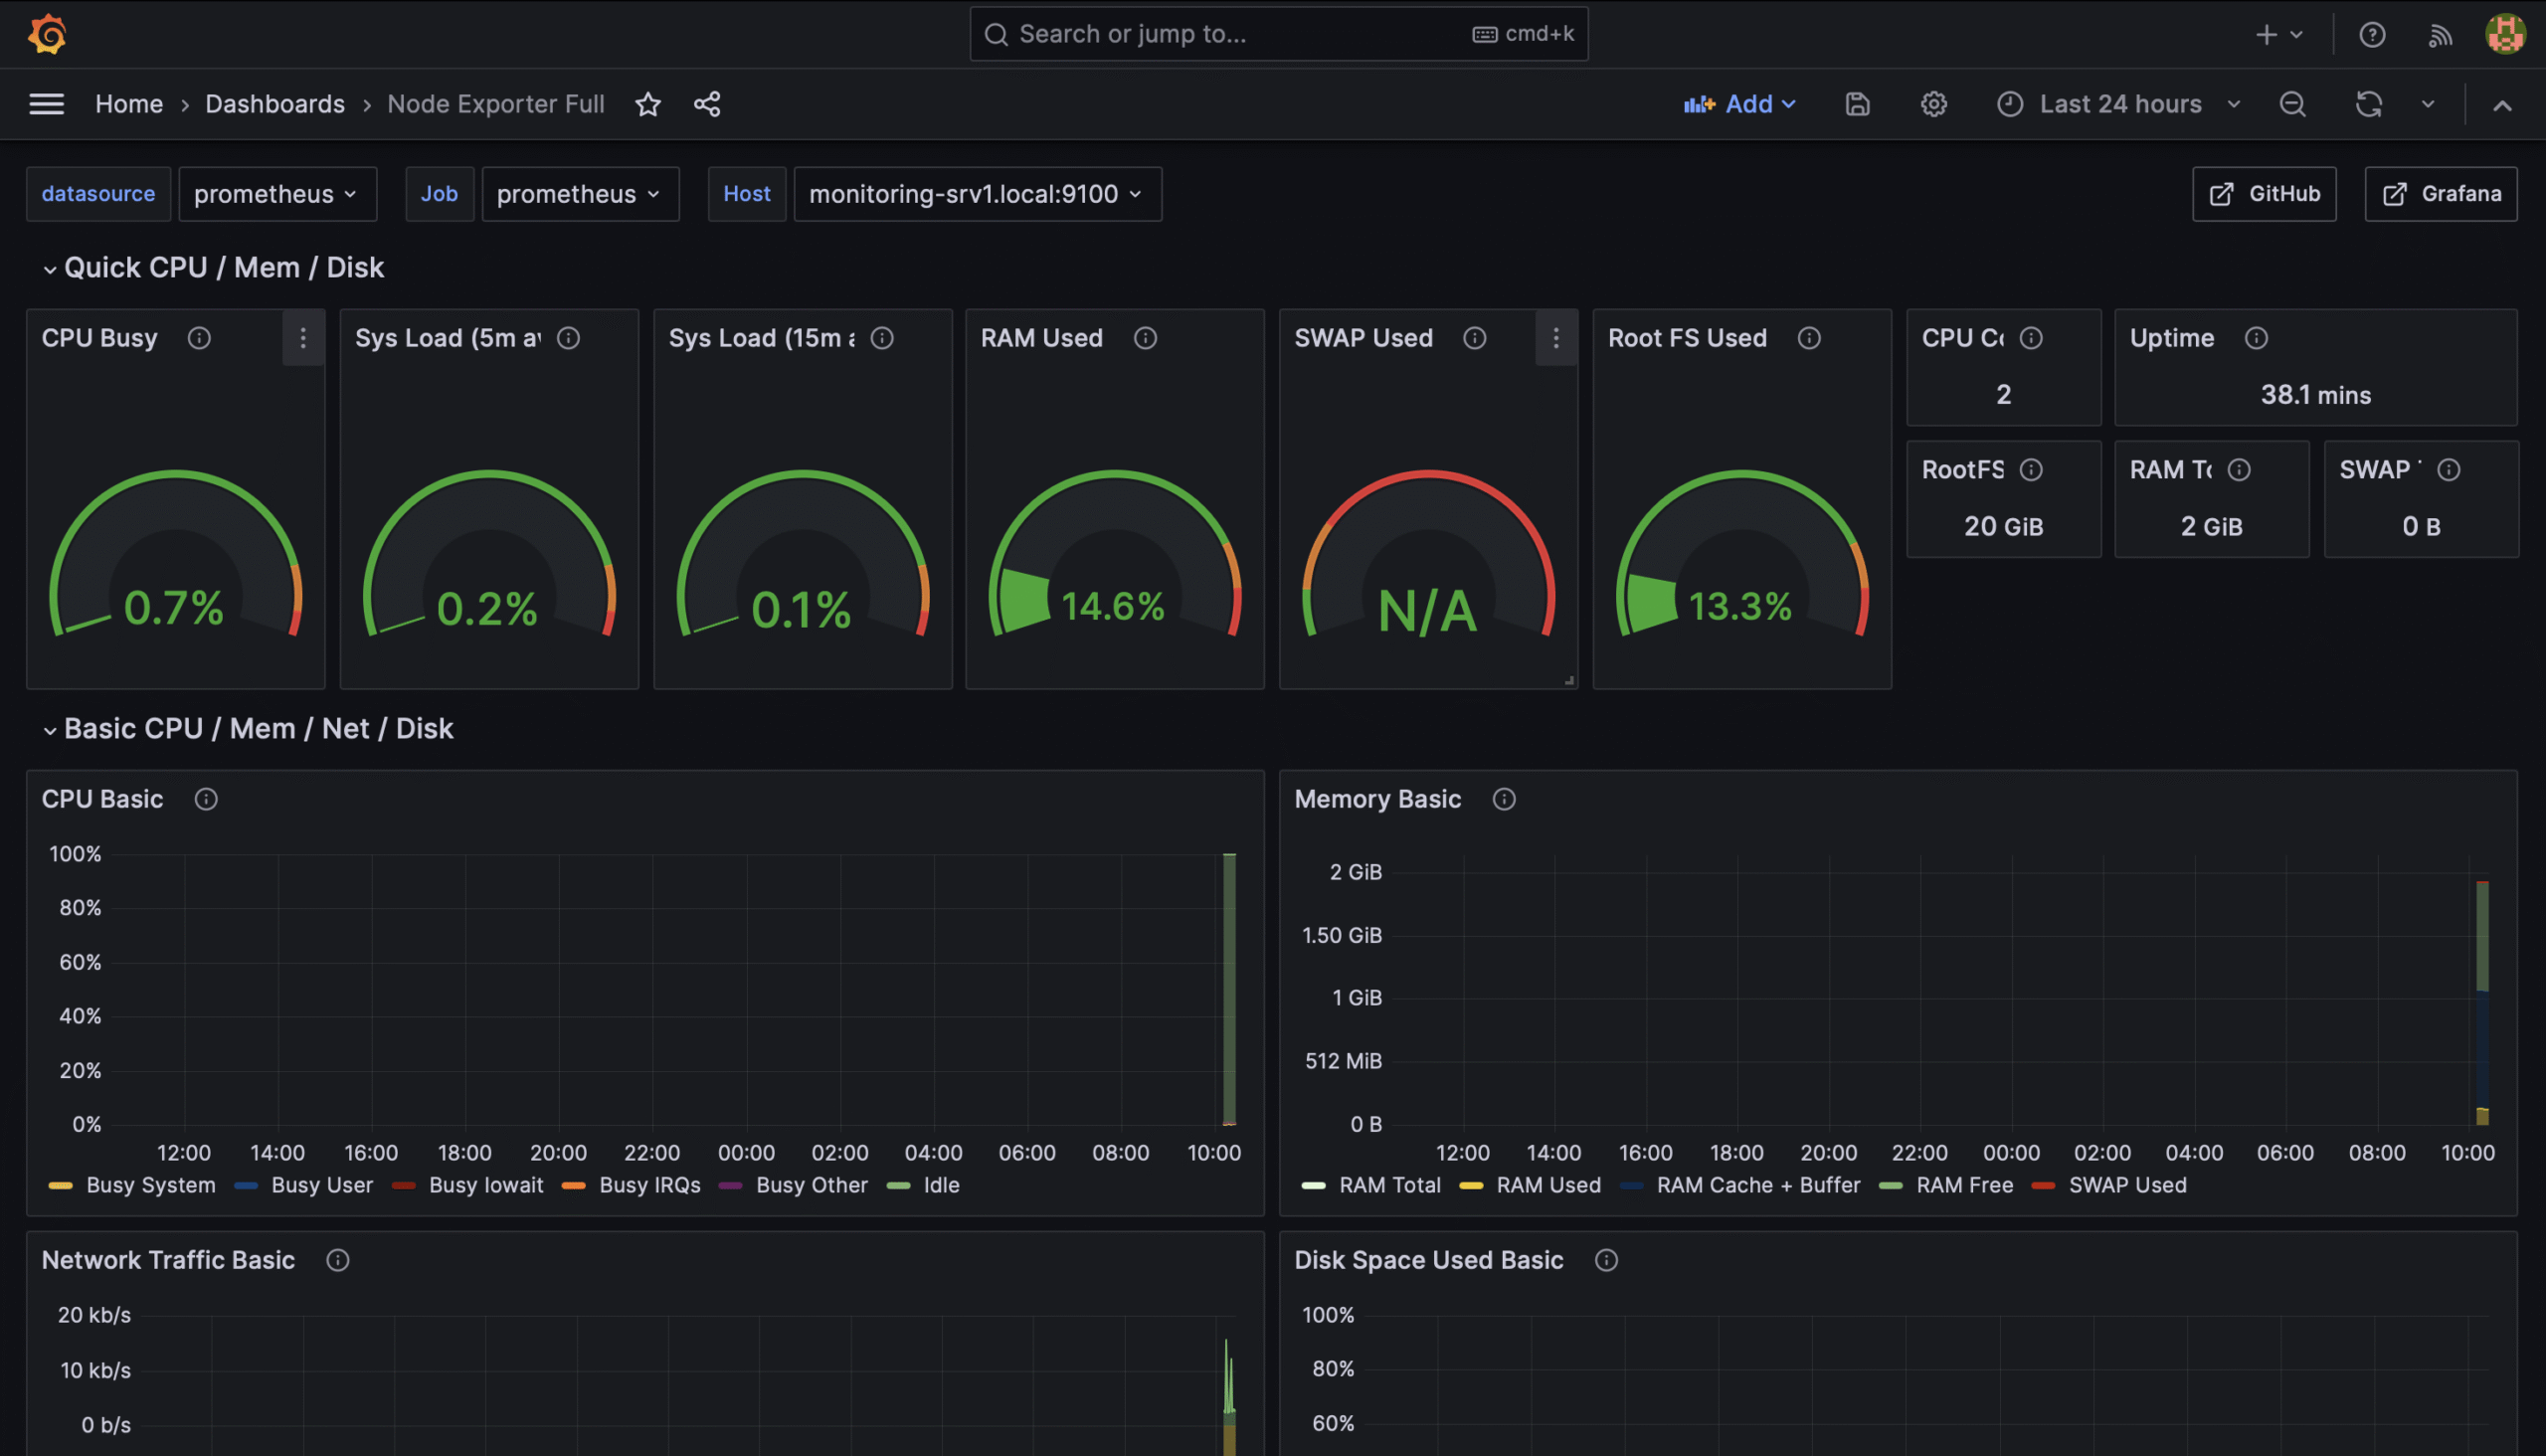
Dat is alles! We hebben nu een werkend monitoring dashboard.